

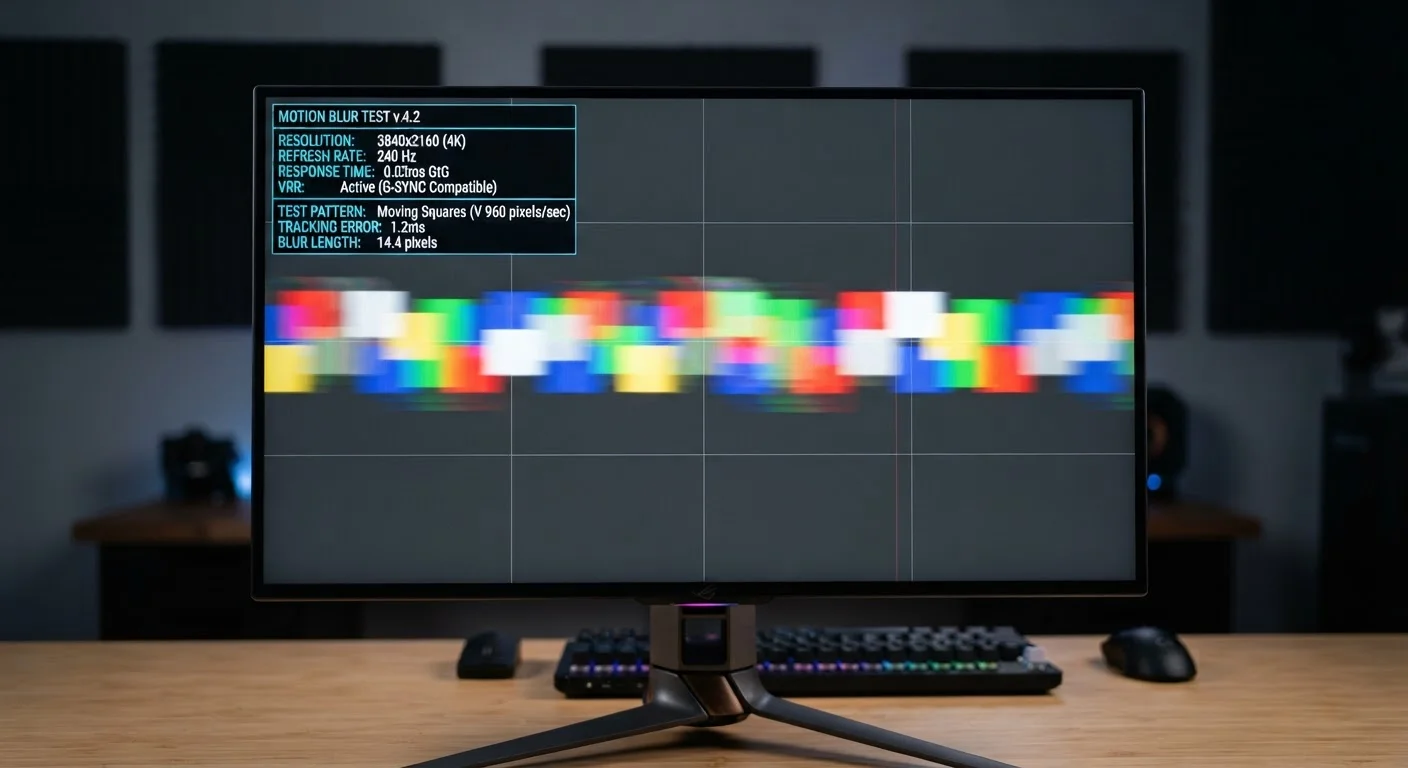
Why These Three Specs Get Confused
Monitor listings routinely stack refresh rate, response time, and input lag in the same bullet point, making them look interchangeable. They're not. Each measures a completely different part of the display process - and conflating them leads to either overpaying for specs you don't need or overlooking a number that would actually affect you every day.
This glossary breaks each term down plainly, explains the units manufacturers use, and tells you which use cases actually push these numbers to their limits. For a broader look at how to read any spec sheet critically, see our guide to decoding product specifications.
| Common refresh rate options | 60 Hz, 75 Hz, 120 Hz, 144 Hz, 165 Hz, 240 Hz |
| Typical GtG response time range | 1 ms - 8 ms |
| Perceptible input lag threshold (casual use) | ~20 ms (Generally cited by display researchers and independent reviewers) |
| Input lag tested by | Third-party reviewers (not standardized on spec sheets) |
| Panel types affecting response time | TN, IPS, VA, OLED |
Refresh Rate (Hz): How Often the Picture Updates
Refresh rate measures how many times per second a monitor redraws the image on screen, expressed in hertz (Hz). A 60 Hz panel redraws 60 times per second; a 144 Hz panel redraws 144 times.
Higher refresh rates produce smoother-looking motion because there are more frames between each position of a moving object. The difference between 60 Hz and 120 Hz is visible to most people in everyday use - scrolling, dragging windows, and cursor movement all look less choppy. The jump from 120 Hz to 240 Hz is subtler and mainly benefits competitive gaming where split-second timing matters.
One important caveat: refresh rate sets a ceiling, not a floor. Your computer's graphics output also has to deliver enough frames per second to fill that ceiling. A 144 Hz monitor fed a 60 fps signal still only shows 60 distinct frames per second. For desktop productivity and video, 60-75 Hz is generally sufficient. For gaming or motion-sensitive work, 120 Hz and above is where the difference shows. Our in-depth look at refresh rates and motion smoothing explores how these numbers translate to actual picture quality.
Refresh Rate
The number of times per second a monitor redraws its image, measured in hertz (Hz). Higher values produce smoother motion but require the connected device to output a matching frame rate to make a difference.
Response Time
The time a single pixel takes to change from one color to another, stated in milliseconds (ms). Shorter response times reduce ghosting behind moving objects. GtG and MPRT are two different measurement methods that aren't directly comparable.
Input Lag
The total delay between a user's physical input and the visible result appearing on screen. It's driven by monitor signal processing and is distinct from response time, though both affect perceived responsiveness.
GtG (Gray-to-Gray)
A common response time measurement method that records how long a pixel takes to transition between two mid-gray shades. It's widely used but can be measured at different gray levels, making cross-brand comparisons imprecise.
MPRT (Moving Picture Response Time)
A response time measurement that captures how long a moving image appears blurred rather than how fast a pixel switches. It reflects perceived motion blur more holistically than GtG but is not the same metric.
Ghosting
A visual artifact caused by slow pixel response times, appearing as a faint trailing smear behind fast-moving objects on screen. More visible at higher refresh rates where pixel transitions can't keep up with frame delivery.
Response Time (ms): How Quickly a Pixel Changes
Response time measures how long a single pixel takes to transition between colors, stated in milliseconds (ms). The most common measurement you'll see is GtG (gray-to-gray), though some manufacturers use MPRT (moving picture response time), which captures motion blur rather than pixel switching speed alone. The two are not directly comparable.
Slow pixel transitions leave a smear - called ghosting - behind fast-moving objects. A 5 ms GtG panel can produce noticeable ghosting in fast games; a 1 ms panel largely eliminates it. For document work, video streaming, or casual gaming, response times under 5 ms are unlikely to be perceptible. Competitive gaming and high-frame-rate titles are where 1-2 ms matters.
Panel technology also plays a role here. IPS and VA panels have historically had slower response times than TN panels, though modern IPS monitors have closed much of that gap. Understanding how panel type affects this spec is covered in detail in our panel technology explainer.
~16.7 ms
Time between frames at 60 Hz
At 60 Hz, each frame occupies 16.7 ms - meaning a 5 ms response time still leaves most of that window available for the pixel to settle.
1-10 ms
Typical gaming monitor input lag in game mode
Figures commonly reported by independent monitor review sites for panels tested with processing features disabled.
Input Lag: The Gap Between Action and Reaction
Input lag is the delay between a physical input - pressing a key, moving a mouse - and the corresponding change appearing on screen. It's measured in milliseconds and is distinct from both refresh rate and response time, though all three contribute to the overall feel of responsiveness.
Input lag is largely a product of the monitor's internal signal processing: image scaling, color correction, and onboard features all add small delays. Most monitors marketed for gaming declare input lag figures between 1 ms and 10 ms in their "game mode" settings, which typically disable processing features to minimize delay. For general computing, input lag under 20 ms is imperceptible to most people. Beyond 50 ms, even casual users start noticing a disconnect between mouse movement and cursor response.
Because manufacturers don't always publish input lag figures - it's tested by third-party reviewers rather than standardized on spec sheets - it can be harder to evaluate than Hz or GtG numbers. Checking independent monitor tests is the most reliable way to get this data. For context on how resolution choices fit alongside these performance specs, see our look at 4K versus 1080p in everyday use.
The content on this site is for informational purposes only and is not a substitute for professional advice. Always consult a qualified professional for guidance specific to your situation.