

How Price Trackers Actually Collect Data
Price tracking tools work by periodically checking a product page and recording the price they find. Most tools use automated web scraping - software that reads the publicly visible HTML of a retailer's page - or official product data feeds when available. That recorded price gets added to a database, building the historical chart you see when you look up an item.
The key variable is polling frequency. A tool that checks prices once a day will miss a flash sale that lasts six hours. Tools that check hourly or more often give a more complete picture, but even they can have gaps. Understanding this limitation matters: the chart you're reading is a sample of prices, not a complete record of every price change that ever occurred.
Coverage also differs by retailer. Some tools have robust data for major national platforms and thin or no data for regional chains, specialty stores, or grocery retailers. Before trusting a tracker's history for a specific store, verify that the tool actually covers it. This is especially relevant if you shop across multiple channels - something worth keeping in mind as part of broader product research before any purchase.
Tracker Data Reflects Public Prices Only
Price tracking tools capture what's publicly displayed on a product page. They don't account for loyalty discounts, credit card rewards, promo codes applied at checkout, or cashback portal returns. Your actual out-of-pocket cost may differ from the tracked price in either direction. Always factor in total cost of purchase, not just the listed price.
What the Price History Chart Is Really Showing You
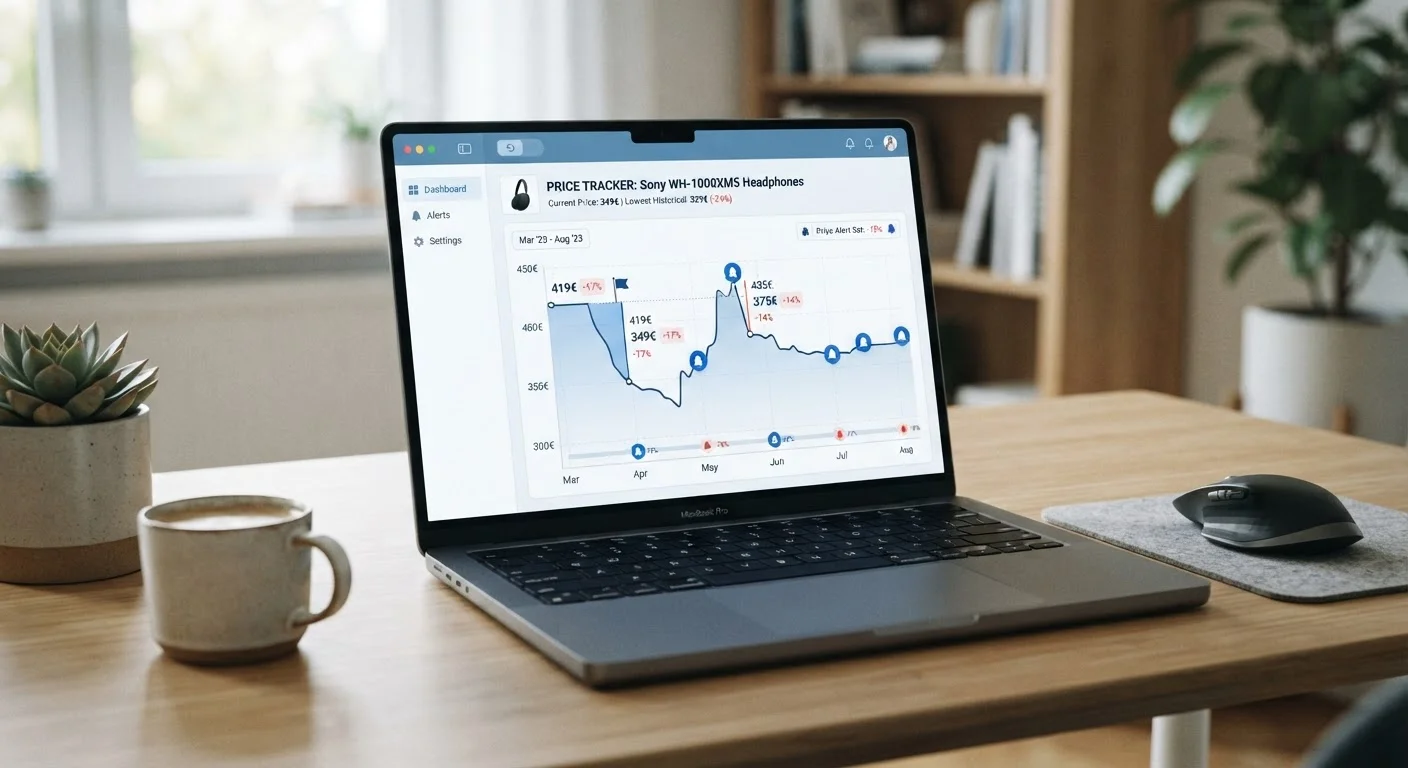
The chart is a record of what the retailer's page displayed at the time the tool checked - nothing more. It doesn't reflect your negotiated price, coupon codes applied at checkout, cashback, or bundled offers. The displayed price and the effective price you pay can be different numbers.
More importantly, price history charts are your primary defense against artificial inflation. A common retail tactic involves briefly raising a product's listed price weeks before a promotional event, then advertising the subsequent markdown as a significant discount. On a price history chart, this shows up as a sudden spike immediately before the promotional period - a reliable signal that the "sale" price may not be the genuine low it appears to be. Reading a price history chart carefully can make this pattern obvious before you commit.
97%
Share of online shoppers who compare prices
According to a survey by the National Retail Federation, the vast majority of U.S. online shoppers check prices across multiple sources before purchasing.
~30%
Products with inflated pre-sale pricing
Consumer advocacy analyses of major retail events have found that roughly a third of advertised discounts are based on prices that were temporarily inflated before the promotion.
Understanding seasonal cycles adds another layer. Many product categories follow predictable markdown calendars, and a price that looks low compared to last month might still be above the annual low. Pairing tracker data with knowledge of when prices actually drop by category gives you a more complete picture.
Setting Alerts That Actually Work for You
A price alert is only useful if you set the threshold at a price you'd genuinely act on. Many shoppers set alerts at arbitrary round numbers or default to whatever the tool suggests. A more practical approach: decide the maximum you're willing to pay before you set the alert, then use the price history to judge whether that threshold is realistic.
Set Your Target Price Before Checking History
Decide what you're willing to pay for a product before you look at its price history chart. This prevents the chart from anchoring your expectations to whatever the recent range happens to be. Once you have your number, use the history to judge whether that threshold is realistic - not to rationalize a price you've already seen.
If a product has never dipped below $180 in two years of history, setting an alert at $120 wastes your attention. Conversely, if the history shows regular dips to $145 every quarter, setting an alert at $150 gives you a realistic trigger. The historical data informs what threshold makes sense - the alert is just the delivery mechanism.
Once an alert fires, treat it as a prompt to investigate, not a command to buy. Check the current chart, confirm the price is genuinely at or near a historical low, and run through a quick pre-purchase verification. A structured pre-purchase checklist - covering return policies, stacked discounts, and total cost - turns a tracker alert into a confident decision rather than an impulse.
Limitations Worth Knowing Before You Rely on Any Tool
Price trackers are informational tools, not guarantees. Several real-world limitations affect how much weight you should put on any single data point:
- Marketplace seller complexity: On platforms with multiple third-party sellers, the "price" the tool captures may correspond to a seller that's no longer the default option by the time you arrive. Seller prices fluctuate independently of the main retailer.
- Variant-level gaps: Trackers typically log a price at the product level. A specific configuration - a particular color, storage size, or bundle - may have a different price history than the base product page.
- Geographic and account-level pricing: Some retailers vary prices by region or show personalized prices to logged-in users. A tracker scraping from one location may not reflect what you see in your account.
- Data freshness: If a tool hasn't checked a product recently, the displayed current price may already be stale.
None of these limitations make price trackers not worth using - they remain among the most practical tools available to everyday shoppers. They simply mean price tracker data should inform your decision, not replace judgment. Applying this same critical lens to other consumer tools is worthwhile; the same questions about accuracy and coverage apply whether you're evaluating fitness trackers or spending apps.
Frequently Asked Questions
Most widely used price tracking tools offer free core functionality, including price history charts and drop alerts. Some offer premium tiers with faster polling, more tracked items, or additional data exports. Free versions cover the needs of most everyday shoppers.
No. Coverage varies significantly by tool. Some focus on major e-commerce platforms; others include grocery chains, electronics stores, or regional retailers. Always verify whether your intended retailer is supported before relying on a tool's data.
This depends on the tool. Some track only the primary retailer's price, while others track third-party seller prices separately. Marketplace prices fluctuate more frequently and can be harder to track consistently, so data may have gaps.
Coverage depends on when the tool first started tracking a given product. Well-established tools may have years of data on popular items. Newly listed products or niche items often have limited history, sometimes just weeks.
Yes, this is a known tactic. A retailer can briefly raise a product's listed price before marking it down, making the discount appear larger. Price history charts reveal this pattern - look for a sharp artificial spike just before a promotional period.
A price alert is a forward-looking notification triggered when a price hits your set threshold. A price history chart is a backward-looking record of every price the tool captured. Both are useful, but the chart is what gives context to whether an alert is worth acting on.
The content on this site is for informational purposes only and is not a substitute for professional advice. Always consult a qualified professional for guidance specific to your situation.